An awesome FP&A function will help drive business success. I’ve been a CFO, and I work with CFOs and Finance teams, a lot. I often design and build out Finance data warehouses, set up reporting, planning, forecasting and dashboarding solutions for finance and the broader business. Once the basics are sorted (think core consolidations, reporting and the like) CFOs will often ask about how to improve their FP&A function and their budgeting/forecasting processes. I enjoy these conversations and the types of projects that result.
Two important steps toward an awesome FP&A function is demonstrating a clear understanding of the business and presenting analysis in terms the business understands.
Step 1. Model all your key numbers.
It sounds simple. The forecast or budget numbers must (predominantly) come from a logical driver-based model that demonstrates a clear understanding of the business. I don’t mind if the model is drafted in Excel, but the model (and all its drivers) needs to end up in a database (cloud preferably) and that database or Datawarehouse should be owned by Finance. This allows seamless reporting and analysis and helps solve the source of truth challenge. My preference is SQL Server with a Calumo (and Excel) front-end but there are many tools that can be considered.
What do I mean by model? I mean the budgeted and forecast numbers need to be driven by meaningful business metrics and all those metrics need to be available (not hidden away in Excel or some other tool).
Revenue and Employee costs are obvious examples.
If your business generates revenue by selling different types of widgets then your budget and forecast models should, as a minimum, be predicting how many widgets you are going to sell, what type and at what price. These budgeted or forecast widget numbers drive your Revenue number. When you get to the stage of comparing Actual to Budget you should be able to easily break Revenue down by Widget volume, type and price and hence have an immediate and intuitive deeper understanding of any variance.
Employee costs are similar. They should be built up from an employee model that tracks each employee, different roles, commissions and/or changes in salaries. Just like Revenue understanding variances in employee costs is much easier when you can see the numbers broken down by Employee and Role. Not to mention all the HR-related analytics that can be produced and compared against actuals, budget and forecast.
Step 2. Include Context in your FP&A Analysis
Apart from more meaningful analysis, another key benefit of modelling (and having the workings available in a Datawarehouse for inclusion in analysis) is business engagement. Most non-finance business managers think in terms of what they do and what they deliver be it the number and mix of widgets, the size and timing of new construction projects, actual employees and potential hires or hourly billing rates. If busy business executives are provided financial analysis in the context of things that know and control, the level of engagement skyrockets.
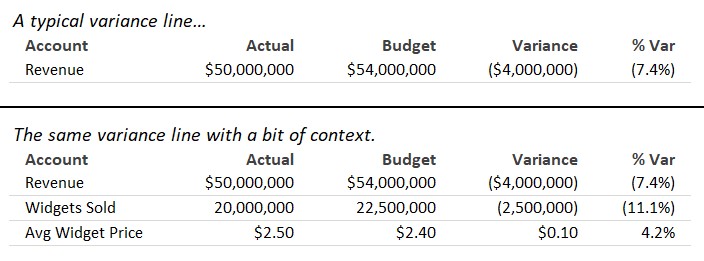
Any financial reporting or analysis is made so much more interesting and gets so much engagement when operational metrics are included. Seeing a revenue number of $50M versus a budget number of $54M is good. Seeing how it was derived using meaningful business metrics that business managers can relate to, is great, and will dramatically increase engagement.
Below is a simple contrived example comparing a typical financial variance line with that same line in context. Of course, the reality is often more complex and needs to account for accruals, adjustments and whatever else, but in a good setup that is certainly manageable. Live links into operational systems that enable comparison to model drivers and that provide business context generate exponentially more value, and of course... from the below drilling down to individual sales, sales by salesperson, or whatever makes sense for the business, should just be a few clicks away.
This post includes FP&A in the title because in my experience every FP&A team I’ve helped has benefited greatly from adopting this approach. More recently the inclusion of business metrics and extension of FP&A across the enterprise has been rebranded to XP&A (or eXtended Planning and Analysis). For me, this is a must-have as it enables the CFO and FP&A team to provide true strategic business advice and insight.
It doesn’t stop there. With good database models, linked to both financial and operational systems, the adoption of 3-Way budgeting and rolling forecasts is also achievable.